San Diego - CA USA MULTIFAMILY MARKET REPORT (2026)
Market Report 2026 July Update
San Diego Multifamily
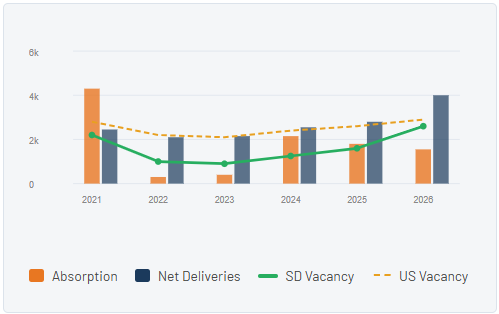
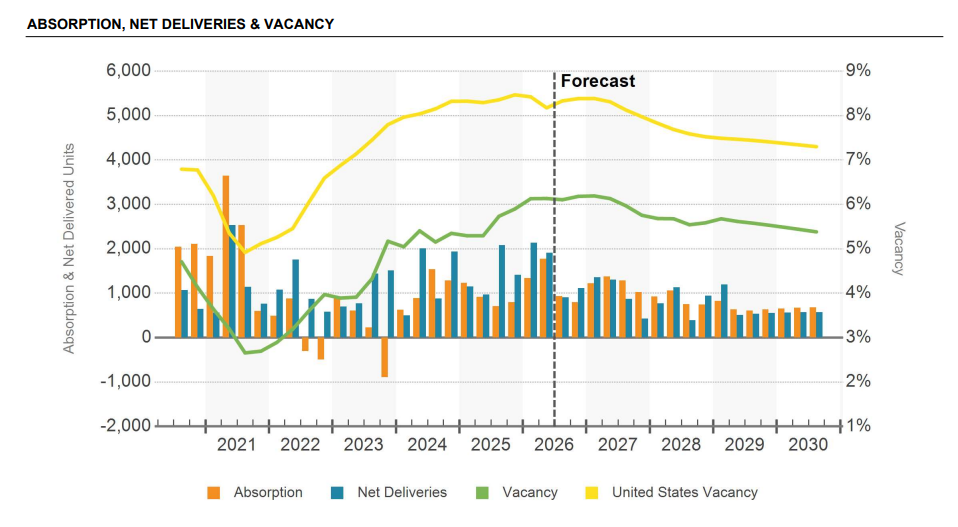
San Diego’s apartment market is adjusting to a period of elevated supply, with vacancy rising to its highest level this century after net completions outpaced demand by over 40% in the past year. This year is on pace to exceed last year’s 25-year high in completions.
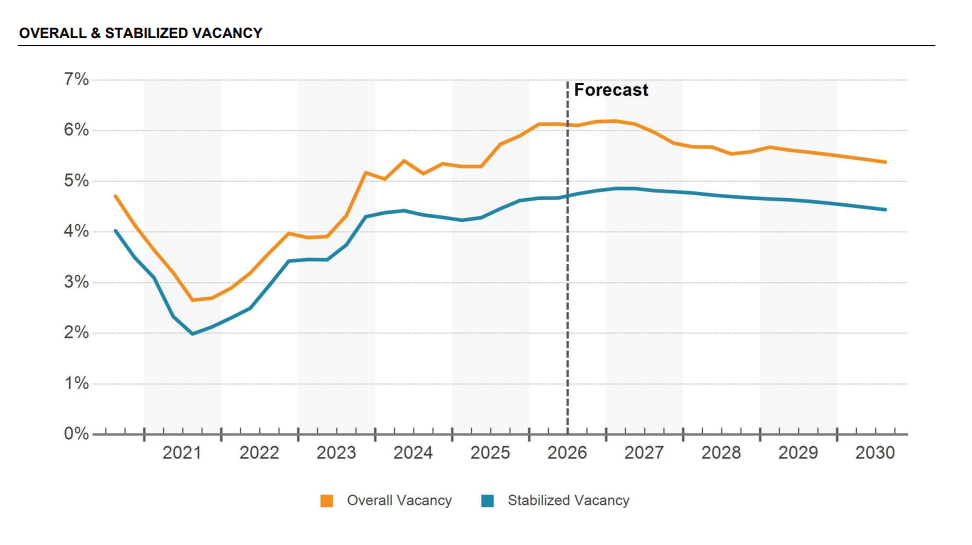
With many of these properties still in lease-up — which have lengthened relative to historical norms — few areas of San Diego have been able to sidestep rising stabilized vacancy. Mission Valley, coastal submarkets, and the South I-15 Corridor have been among the only areas where stabilized vacancy has fallen year over year.
Affordability has been a defining constraint on demand. Elevated living costs driven by prolonged inflation, combined with rent growth that has outpaced wage gains over the past five years, have impacted renter mobility and slowed household formation.
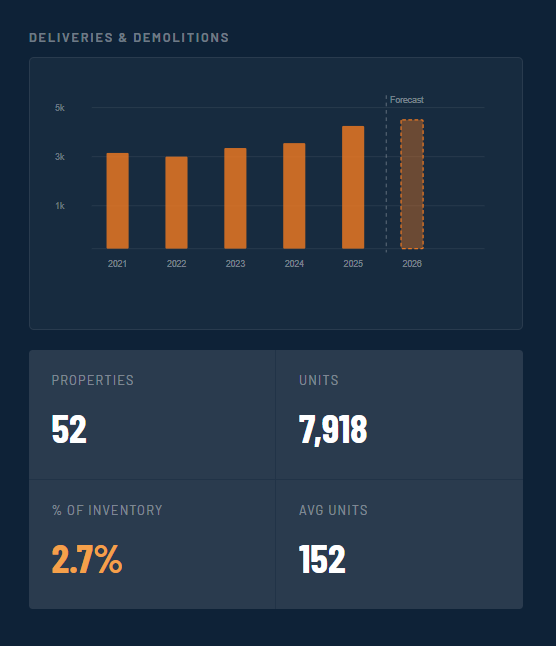
Nearly all new deliveries fall within the luxury segment, contributing to rising vacancy among 4 & 5 Star properties, which sits at 11.4% as of the third quarter. Approximately 6,000 units are scheduled to deliver this year, following 5,500 completions in 2025, and roughly 7,900 units are under construction. The 10-year average for the under-construction pipeline has been 8,800 units. Development activity has been most pronounced in Mission Valley and the Balboa Park neighborhoods, where higher-density zoning tied to the Complete Communities initiative has supported sustained construction near transit priority areas.

Vacancy What You Should Headline Now
Vacancy is forecast to remain elevated through 2027 as San Diego navigates its highest vacancy level this century — yet still well below Sun Belt markets like Atlanta and Phoenix where vacancy has plateaued in double digits.
Cost-of-living pressures continue to weigh on renter demand. Inflation and housing costs have exceeded wage gains since 2021, contributing to slower household formation and increased renter consolidation. Office-using jobs have fallen by over 20,000 from their peak in 2022.
The latest census estimates indicate international migration declined 60% year over year, and the share of prime renters aged 20–34 fell by 1.2%. Operators in South County, National City, East County and North County report these dynamics have contributed to rising vacancy.
For inventory that opened in 2024, occupancy has had trouble rising above the mid-80s. With further supply pressure, it will be difficult to materially increase occupancy without hefty concessions or lower lease rates.
Short-Term Pressure. Long-Term Under-Delivery.
San Diego’s under-construction pipeline has finally begun easing. Roughly 6,000 market-rate units are scheduled to be delivered this year after 5,500 units were completed last year — the highest level of new supply in more than two decades.
Development costs for new luxury projects often exceed $600,000/unit, and in some instances, newer vintages have traded below their construction cost. Soft costs can exceed 50% of total development expenses.
Since 2020, studios and one-bedroom units have accounted for over 60% of deliveries. With fewer multi-bedroom units being built, larger family renter households have fewer choices, often compelling them to leave San Diego.
Development activity has been most concentrated in Mission Valley — with almost 10% of existing inventory currently under development — and Balboa Park, where roughly 1,800 units are expected this year.
Why Cap Rates Matter by Location

Supply-heavy submarkets including Downtown, Balboa Park, and Mission Valley are recording year-over-year rent declines — Downtown effective rent growth sits at -2.6% YOY with a 10.8% concession rate.
Coastal submarkets and the South I-15 Corridor have been among the only areas where stabilized vacancy has fallen year over year, benefiting from proximity to employment centers and limited new supply.
- Downtown SD concession rate: 10.8% — highest in the market
- La Jolla/UTC effective rent growth: +0.3% with limited supply
- North Shore Cities: only submarket with strong positive effective rent growth +4.1%
- Mission Valley effective rents down -3.4% YOY amid 2,555 units under construction
- National City/South Central: lowest concession rate at 1.6%
In fact, vacancy at sale can sometimes improve marketability
Rent Prices Fall for the First Time — A Historical View
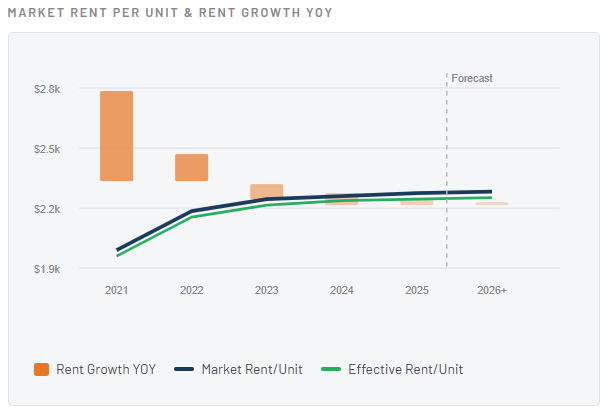
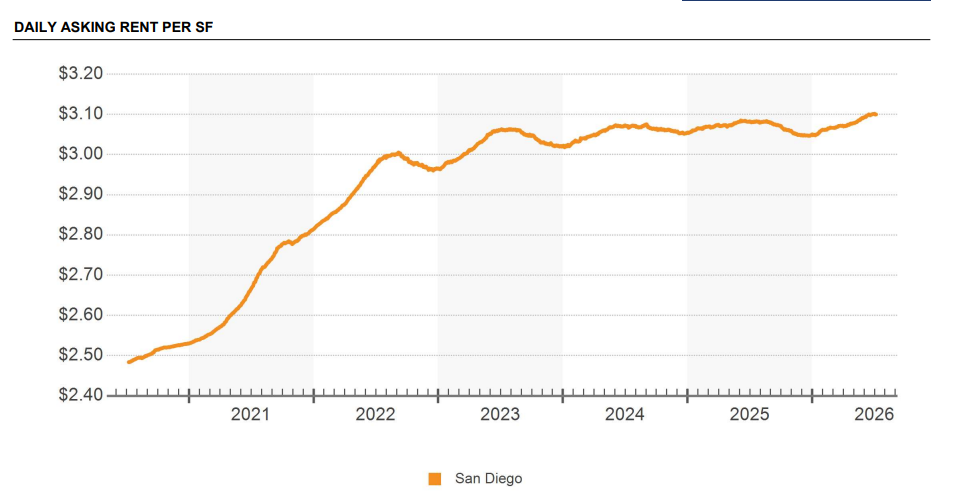
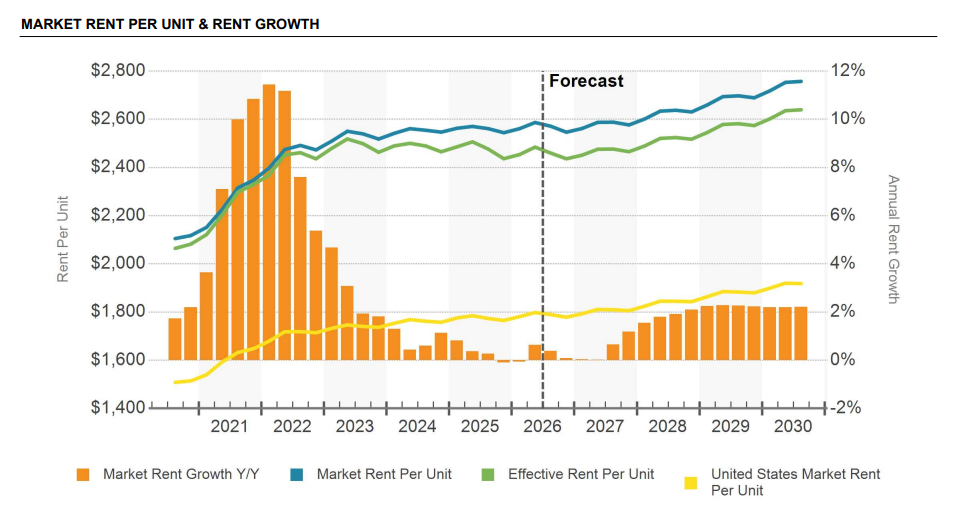
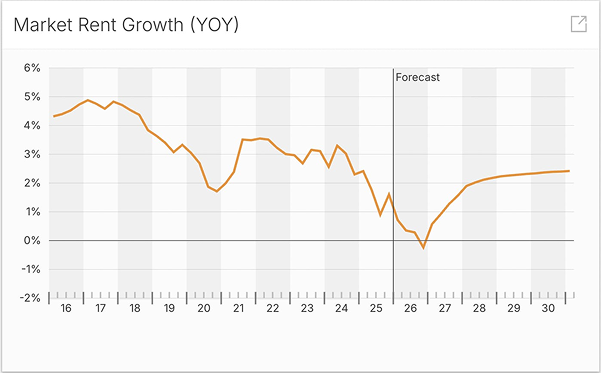
Asking rent growth has measured 0.7% year over year compared to 0.8% nationally, bringing average market asking rents to $2,590/month. The long-term benchmark has been 3.0%, and rents fell last year for the first time in 15 years.
Annual rent growth peaked at 11.4%, effectively compressing nearly four years of typical increases into a single year. While rent growth has since cooled, rent-to-income ratios frequently remain above 40%, leaving limited capacity for additional rent hikes.
Approximately 40% of properties reported offering concessions during 26Q1 — roughly three times the long-term norm. At newly delivered communities, concessions can reach up to 10 weeks free. Rent growth is not forecast to return to the long-term average before 2028.
$2,590/mo average asking rent · $2,484/mo effective rent · -0.8% effective rent growth YOY · Long-term norm: 3.0%
Economy
San Diego County is home to over 3.3 million people. The region’s economy is anchored by defense (nearly 360,000 jobs, 23% of GDP), life sciences (85,000+ workers, 80+ research institutes), and tourism ($15B annual visitor spending).
However, since 2020, San Diego’s population has fallen by over 16,000. International migration declined 60% YOY. Domestic net migration is falling by roughly 25,000 people annually — driven by housing costs that rank among the nation’s most expensive.
Median household income of $113,948 far exceeds the national median of $84,884. Yet rent-to-income ratios remain elevated, a key drag on renter demand formation.
Find My Hat — Where Do I Stand?
- Population: 3.29M metro · -0.2% 12-month change
- Unemployment: 4.8% (vs 4.5% US) · rising
- Labor Force: 1.67M · -0.1% YOY
- Median HH Income: $113,948 · +2.5% YOY
- Job growth 2025: fell 60% YOY vs 2024, marginally positive
- Defense: 1 in 4 jobs in county economy
San Diego remains a top 10 U.S. multifamily market by value, with an estimated multifamily asset value exceeding $114 billion. Long-term fundamentals remain intact despite 2025–2026 headwinds.
Investment Sales — Sales Volume The Family Is Good
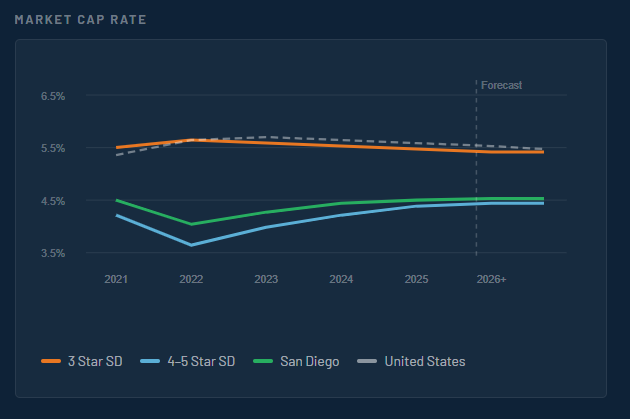
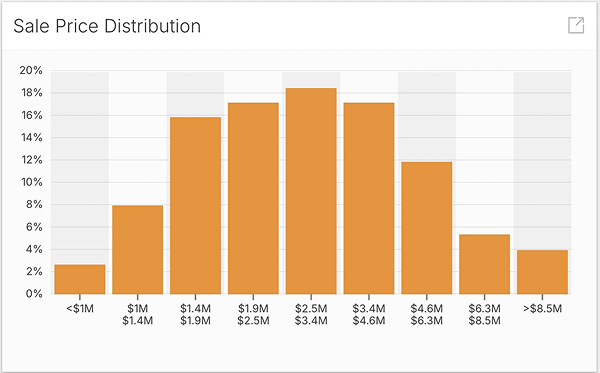
In the past 12 months, $1.8 billion worth of market-rate properties traded. Transaction counts have been down over 40% compared with what was typical before the pandemic. Cap rates have largely landed in a band between 4.5% and 5.5%.
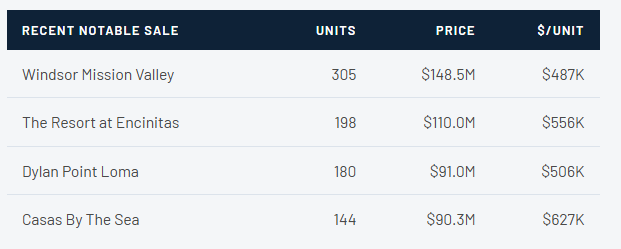
In early 2026, Fairfield Residential purchased The Resort at Encinitas (198 units) for $110M at a 4.7% cap rate. Pacific Urban Investors acquired Casas by the Sea for $90.3M ($627K/unit). MG Properties purchased Dylan Point Loma for $91M.
San Diego’s long-term demand drivers — a strong university system, defense cluster, and diversified job market — should continue to make it an attractive capital destination despite short-term headwinds.
Investment Sales
Submarket Variations – Why Zip Code Matters
San Diego multifamily is not a single market.
It is a collection of micro-markets with very different behaviors.
Luxury-heavy areas like Mission Valley, UTC, and Downtown have absorbed most new construction. These submarkets have experienced the greatest vacancy expansion
. Meanwhile, stabilized 1970s–1990s product in neighborhoods like North Park, Normal Heights, La Mesa, and South Bay has behaved differently. These areas continue to benefit from strong tenant demand and limited new supply.
This is why relying solely on county-wide averages can mislead owners.
At ACI, valuation does not stop at county metrics. We analyze zip code-level transaction data, unit mix trends, and buyer demand patterns before pricing.

The difference between 92116 and 92105 is not theoretical. It is measurable
Star Ratings and Asset Quality
The market report distinguishes between asset classes and star ratings.
Luxury 4 & 5 Star vacancy has climbed to approximately 12%
San Diego Multifamily Market Report (2026)
This reflects:
- Heavy delivery concentration
- Elevated asking rents
- Concession competition
Meanwhile, older 2–3 Star inventory — often workforce housing — has experienced more stable occupancy. Investors evaluating opportunity must understand where the vacancy risk is concentrated. Not all vacancy is equal
Interest Rates and Cap Rate Spread
One of the most misunderstood elements of today’s market is the relationship between interest rates and cap rates.
In 2021 and 2022, interest rates were historically low. Cap rates compressed aggressively because financing was cheap and investor demand was extreme.
Today, average cap rates hover around 4.8–4.9%
San Diego Multifamily Market Report (2026)
Buyers must:
- Focus on operational upside
- Underwrite realistic rent growth
- Control renovation budgets
- Accept longer hold periods
Interest rates, meanwhile, are moderately above that level for most commercial debt.
This creates a narrower spread between borrowing cost and yield.
That does not eliminate transactions. It changes underwriting discipline.
The market has shifted from appreciation-driven returns to operational-driven returns.
That is healthier long term.


Price Per Unit Over Time – A Historical View
Looking at historical pricing trends:
- 2021 average price per unit: $303,557 San Diego Multifamily Market Report (2026)
- 2022 average price per unit: $398,002 San Diego Multifamily Market Report (2026)
- 2023 average price per unit: $370,351 San Diego Multifamily Market Report (2026)
- 2024 average price per unit: $391,279 San Diego Multifamily Market Report (2026)
- 2025 average price per unit: $358,075 San Diego Multifamily Market Report (2026)
Notice something important:
Prices have not collapsed.
They have fluctuated within a disciplined range.
The narrative of “multifamily is crashing” is not supported by transaction data.
Behavioral Shifts – Buyers and Sellers
Sellers must recalibrate expectations formed during peak years.
Buyers must recalibrate rent growth expectations formed during 2021–2022.
The market is not broken.
It is adjusting.
The most successful owners in this environment are those who:
- Maintain properties
- Upgrade interiors
- Improve tenant quality
- Price realistically
- Adapt to new construction competition
The most successful buyers are those who:
- Underwrite conservatively
- Avoid aggressive rent assumptions
- Focus on operational efficiency
- Understand submarket dynamics

Turnover and Time on Market
The average time since sale is 5.6 months
San Diego Multifamily Market Report (2026)
That is longer than 2021, but not abnormal historically
Longer marketing times reflect:
- More underwriting scrutiny
- More lender involvement
- More selective buyers
Properties priced without regard to lender constraints tend to sit longest. This is why we model pricing not just on comparables, but on lender-supported value.
That reduces:
- Price reductions
- Failed escrows
- Extended days on market
Regulatory Overlay – Why Local Knowledge Matters
A market report without regulatory context is incomplete. Multifamily investing in San Diego requires both financial and regulatory literacy.
San Diego multifamily is not just about rent and vacancy.

It is shaped by:
- SB 721 balcony compliance
- AB 1482 rent control
- Tenant buyout regulations
- Defensible space requirements
These regulations influence:
- Buyer risk assessment
- Seller obligations
- Valuation adjustments
- Renovation budgets
Long-Term Outlook
San Diego multifamily is not just about rent and vacancy.
San Diego’s economy remains anchored by:
- Defense spending
- Biotech and life sciences
- Tech employment
- Tourism
- Cross-border commerce
The region continues to attract institutional capital.
Short-term supply pressure does not eliminate long-term demand drivers.
Markets that normalize are stronger than markets that remain overheated.


Cap Rates – Back to Historical Discipline
The average cap rate across recent sales is 4.9%
San Diego Multifamily Market Report (2026)

Looking back:
- 2021: 4.1% San Diego Multifamily Market Report (2026)
- 2022: 3.5% San Diego Multifamily Market Report (2026)
- 2023: 4.4% San Diego Multifamily Market Report (2026)
- 2024: 4.6% San Diego Multifamily Market Report (2026)
- 2025: 4.8% San Diego Multifamily Market Report (2026)
Cap rates compressed during ultra-low interest rate cycles.
They have since expanded and stabilized.
Importantly, San Diego remains a core institutional market. Large investors continue to view the region favorably due to life science, defense, and tech demand drivers
San Diego Multifamily Market Report (2026)
Cap rates today reflect rational pricing — not distress.
Price Per Unit – Where We Stand
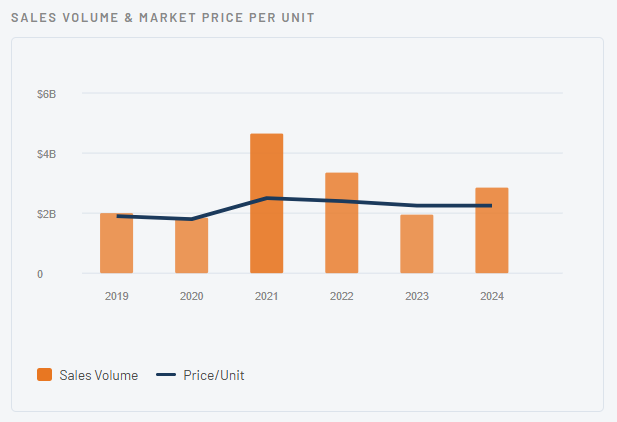
Average price per unit over the past 12 months is $362,097
San Diego Multifamily Market Report (2026)
That number spans:
- 5-unit buildings
- 20-unit neighborhood assets
- 300+ unit institutional properties
Price per unit varies dramatically by:
- Submarket
- Vintage
- Renovation level
- Unit mix
- Vacancy profile
Coastal and core submarkets typically trade at lower cap rates and higher price per unit.
Suburban or older assets may trade at higher cap rates and lower per-unit pricing.
This is why zip code dynamics matter more than broad county averages.
Average price per unit over the past 12 months is $362,097
San Diego Multifamily Market Report (2026)
Sales Volume – The Frenzy Is Gone
Transaction volume peaked in 2021 at $5.6B
San Diego Multifamily Market Report (2026)
It has moderated since:
- 2022: $3.8B San Diego Multifamily Market Report (2026)
- 2023: $2.3B San Diego Multifamily Market Report (2026)
- 2024: $3.3B San Diego Multifamily Market Report (2026)
- 2025: $2.4B San Diego Multifamily Market Report (2026)
The bidding-war environment of 2021 is gone.
What remains is a stable, functioning market where well-priced assets trade.
This is healthier long term.

What This Means for Sellers
Sellers today must:
- Price based on lender-supported underwriting
- Anticipate buyer sensitivity to vacancy
- Be transparent about expenses
- Understand cap rate movement
- Market directly to qualified investor pools
The market-wide average time to sell is 5.6 months
San Diego Multifamily Market Report (2026)
Proper positioning can outperform that.
Proper positioning can outperform that.
Buyers today benefit from:
- Less competition than 2021
- More realistic underwriting
- Negotiation leverage
- Ability to underwrite renovation upside
Buying during disciplined cycles often produces stronger long-term returns than buying during frenzy cycles.
Final Perspective
San Diego remains:
- Geographically constrained
- Economically diverse
- Institutionally desirable
If you are an owner:
You should understand your building’s current income relative to market rent.
You should understand where your submarket sits within the supply cycle.
You should understand how lenders will underwrite your asset.
San Diego multifamily is not collapsing.
It is recalibrating.
That is where disciplined investors thrive.
Short-term supply pressure does not erase long-term fundamentals.
The difference in 2026 is precision.
Owners who understand the data make better decisions.
Investors who underwrite conservatively outperform.
If you are a buyer:
You should focus on quality locations.
You should underwrite conservative rent growth.
You should prioritize operational upside over speculative appreciation.
FAQs – San Diego Multifamily Market
Is the San Diego multifamily market declining?
No. It is normalizing after an overheated rent and transaction cycle. Sales are still closing, cap rates have stabilized, and institutional capital remains active.
Are cap rates expected to rise significantly?
Cap rates have already expanded from 2021 lows and are currently stabilizing near 4.8–4.9%.
Major expansion would likely require significant interest rate shifts.
Does higher vacancy mean falling prices?
Is now a good time to sell?
Is now a good time to buy?
Disclaimer
Last Updated: 15/07/2026
This market report was prepared March 1, 2026 using ACI Apartments’ in-market experience, discussions with lending and title partners, and data sourced from CoStar and other industry reporting tools. While every effort has been made to present accurate information, ACI Apartments does not guarantee the completeness or reliability of all data presented. Market conditions, financing environments, and regulations change frequently, and this report should be used for informational purposes only. This report will be updated periodically throughout the year as new market data becomes available.