
The graph above shows homeownership by age group, comparing data from December 2011 and December 2014. Based on the data, homeownership has decreased more for the age groups of 35–44 and 55–64 than others.
There are many trends that can explain why homeownership has declined across the board. While the economic recovery continues, millennials still struggle to afford to buy homes as an after-effect of the 2008 economic downturn, as reflected by the table below. Baby boomers are expected to have more active retirements than previous generations and may be choosing to downsize or rent smaller spaces.
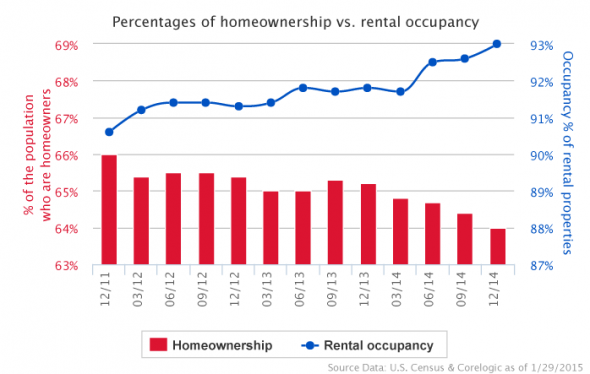
With the decreasing homeownership rates, it’s no surprise that the graph and chart below show that rental occupancy has consistently increased these past three years. In addition, more properties are being used for rentals. However, the chart indicates that inventory has been staying relatively consistent (apart from seasonal shifting), which could help stabilize housing costs and make homes more affordable.
Health of new residential construction
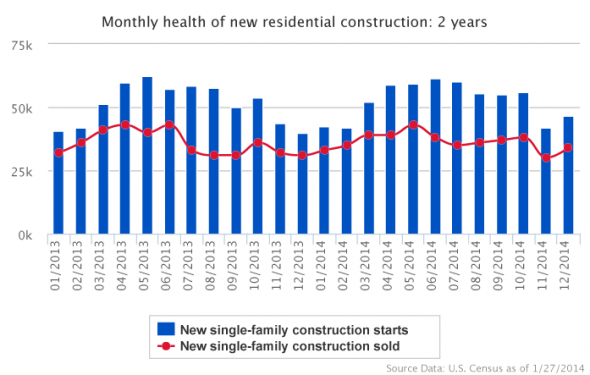
The first graph compares the number of new home starts with the number of new homes sold during the same month. According to the graph, there’s a fairly consistent correlation between the two numbers, which peak and decline around the same time, although some exceptions are reflected.
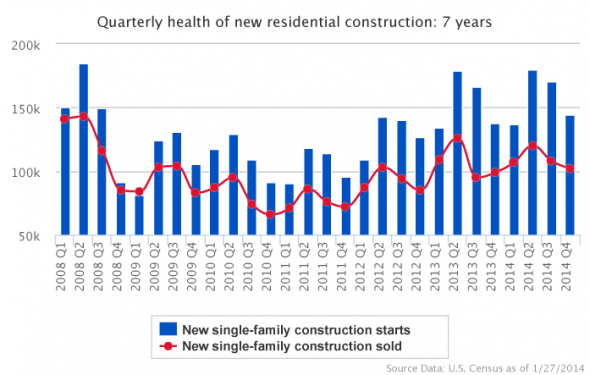
Both the two-year and seven-year overview show a seasonal effect, where construction and new home sales decline during the winter months and pick up during the spring and summer. But while home sales drop at the end of summer, builders continue to break ground on new homes throughout the winter months. This could be the result of a strengthening of, and growing confidence in, the future purchasing power of home buyers. The following tables provide actual data for the two-year and seven-year periods.
This article was originally published on the Bank of America WeeklyWrap and can be found HERE.