
Occupancy, Average Rent Higher
This article was originally posted by Chuck Ehmann discusses the costs and averages in the large apartment market.
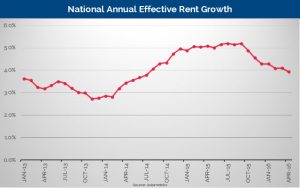
Increasing moderation in larger markets pushed national annual effective rent growth down to 3.9% in April 2016, the first time the rate has been below 4.0% since July 2014, a period of 20 months.
Even though the 4.0% streak ended, the apartment market showed signs of strength in April, as occupancy increased to 95.1% and the $1,277 average effective rent was $12 higher than March’s average. And, the rent-growth figure does jibe with Axiometrics’ forecast of 3.8% for 2016.
 Many of the nation’s largest apartment markets precipitated the drop. Annual effective rent growth in the three San Francisco Bay Area metros decreased 97-136 basis points (bps) in April, while Los Angeles moderated by 102 bps and Charlotte by 77 bps. Denver’s April rent growth was the second lowest of this cycle, and New York’s fell below 1.0% for the first time since February 2014.
And Houston’s 89-bps rent-growth decline in April put that market in negative territory (-0.6%) for the first time since August 2010, as oil and gas industry jobs continued to slow, despite the recent rebound of oil prices past $40 per barrel.
Some large markets did experience increased effective rent growth in April, including Seattle, Dallas and Phoenix.
The national rate was 16 bps lower than March’s 4.1% and 115 bps below the 5.1% of April 2015.
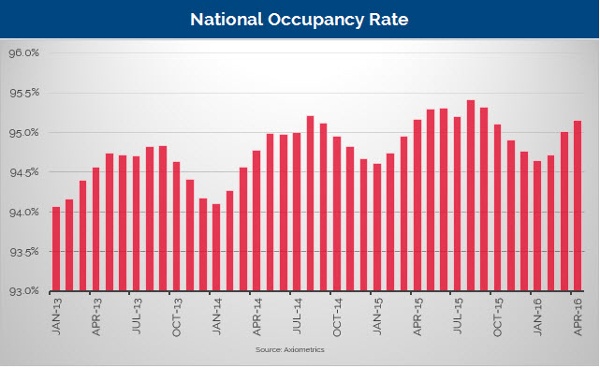
On a more positive note, the national occupancy rate increased for the third straight month, rising 14 bps to 95.1% from March’s 95.0%. The April rate represents the ninth month of the past 13 in which the national apartment market achieved occupancy of 95.0% or higher – the level at which Axiometrics considers an apartment market full.
April’s occupancy rate was essentially the same as that of April 2015.
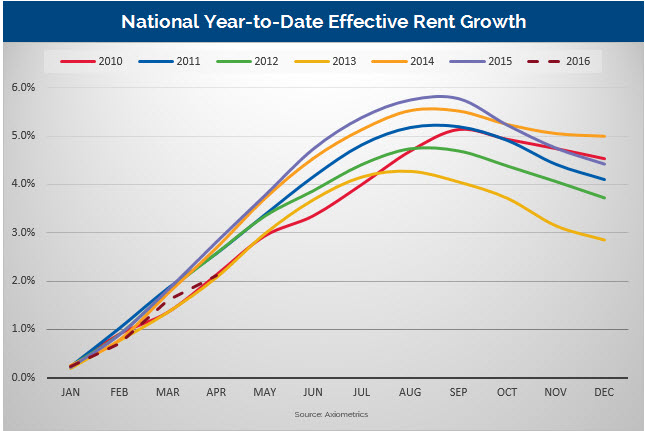
 The pace of year-to-date (YTD) effective rent growth slowed in April, rising 51 bps to 2.1% after a February-to-March increase of 89 bps. That dropped April 2016 to the second lowest April YTD rate in the post-Great Recession period, when extending the figure to two decimal points.
The April YTD rent growth standings:
- 2015: 2.81%
- 2014: 2.68%
- 2012: 2.57%
- 2011: 2.56%
- 2010: 2.12%
- 2016: 2.11%
- 2013: 2.07%
Sacramento Again King of Rent Growth
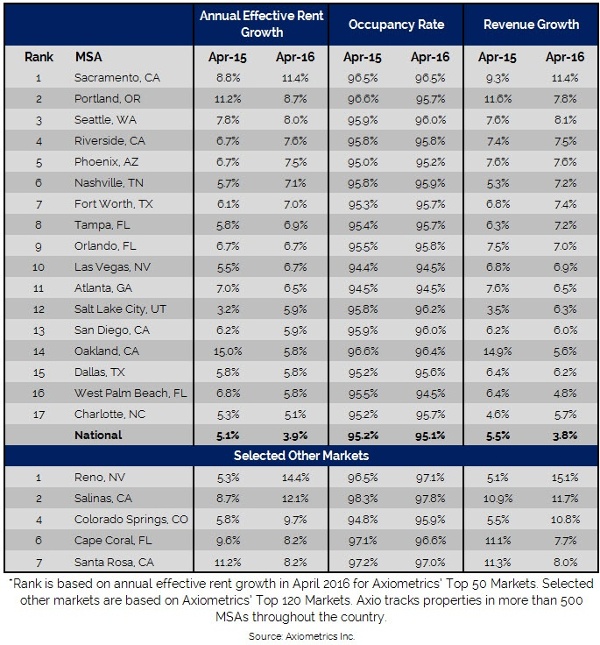
Sacramento, with a rate of 11.4% was the only metro among Axiometrics’ top 50, based on number of units, to achieve double-digit annual effective rent growth in April. As such, it maintained its No. 1 position among the top 50 for the second straight month.
And why not? The metro added more than 22,000 jobs in the 12 months ending March 2016, increasing apartment demand, and only 665 new units were delivered in 2014 and 2015 combined. Just 255 have been identified to come to market this year and 341 for 2017 have been identified.
California’s capital padded its lead over No. 2 Portland, as the Oregon city’s 8.7% rent growth marked the first time since March 2015 that its rate was below 10%. Seattle and Riverside traded the Nos. 3 and 4 spots, while Fort Worth was the biggest mover, rising from No. 13 to No. 8.
Tampa-St. Petersburg and Orlando, as discussed above, were Nos. 8 and 9, jumping from Nos. 10 and 12, respectively.
Los Angeles dropped out of the list of the top 17 markets, leaving four California metros on the list. Dallas rejoined the top 17, coming in at No. 15.
This article was originally posted by AXIOMetrics and can be found HERE.