
Originally posted by Sarah Mikhitarian discusses how social mobility affects income equality.
- Home values and rents have grown more quickly in the parts of the country that historically have provided the most upward socio-economic mobility for children from low-income families.
- Although buying a U.S. home in general is roughly as affordable as ever thanks to low mortgage interest rates, mortgages are less affordable in parts of the country where children in low-income families have experienced greater upward mobility.
The United States has long cherished its hard-earned reputation as the land of opportunity. But for millions working to ensure their children can move up the socio-economic ladder, rapidly rising housing costs are threatening instead to kick the ladder out from underneath them, limiting their potential social mobility.
Home values and rents have increased rapidly in many of the same places that have also historically offered the most upward social mobility for children in low-income families. Recent data from the Equality of Opportunity Project, coupled with Zillow housing data, suggest a door to the middle class for low-income children may be closing as increasingly unaffordable housing forces families out of the areas providing the best opportunities.
Geographic Differences
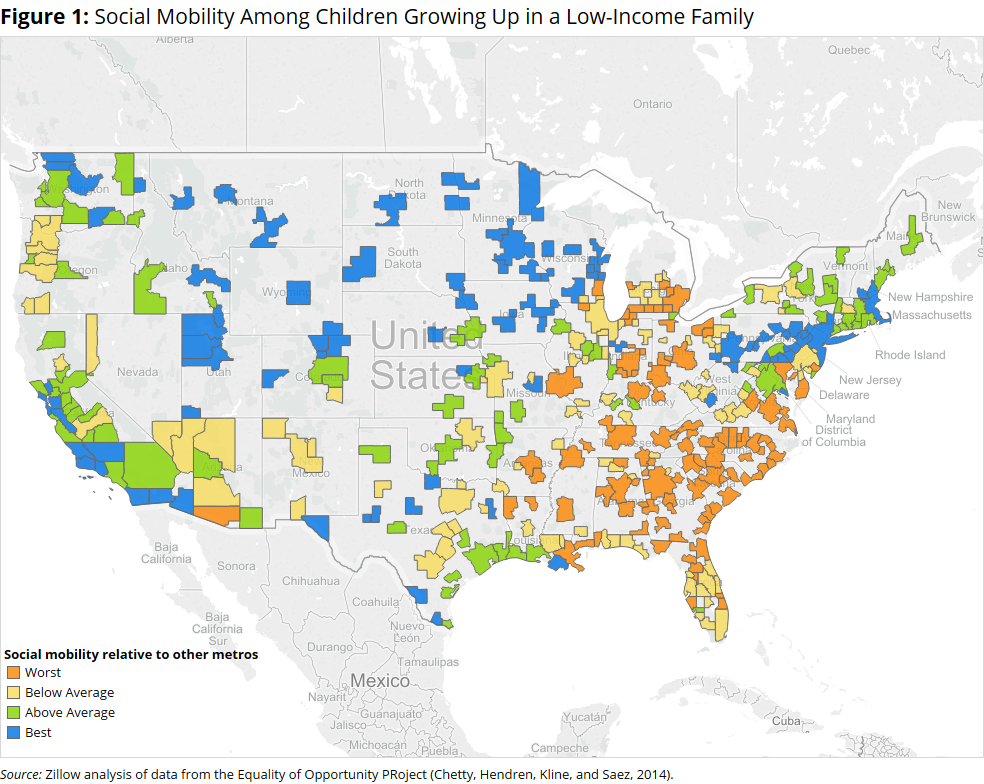
To understand the scale of socio-economic mobility across the United States, economists Raj Chetty and Nathaniel Hendren launched the Equality of Opportunity Project at Harvard University. They studied Americans born between 1980 and 1982, comparing the economic status of a child’s household in the late 1990s to his household’s status as an adult two decades later in the early 2010s.[1] For simplicity, we focus on children born into low-income families or families who earned $28,800 (inflation-adjusted) per year or less.[2]
Children born into low-income families fared much differently over their first 30 years depending on their geographic location (figure 1). For example, if one child grew up in San Luis Obispo, Calif., and the other in Chicago, the child growing up in the San Luis Obispo area would climb higher up the socioeconomic ladder than the one from Chicago, earning $5,300 more per year, on average, as an adult.[3]

Social Mobility and Home Values
For those willing to move across the country to offer their children greater opportunity, it’s getting harder to get a foot in the door. Home values have increased much more quickly in many areas that have historically offered the best opportunities to children born into low-income families. Again using San Luis Obispo and Chicago as examples of places with good and poor mobility, respectively, we found that homes values rose 154 percent in San Luis Obispo and only 30.2 percent in Chicago between the late 1990s and today.[4]
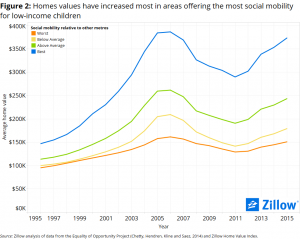 The gap between the average home value in the best and worst places for social mobility has almost tripled over the past two decades (figure 2). In the late 1990s, the average home value in the best places for social mobility was $156,300, compared to $100,100 in the worst places, a gap of 56.1 percent. Today, these numbers have grown to $373,200 and $150,900, respectively – a gap of 147.3 percent.
This large and growing difference is driven in part by the geographic disparities in social mobility. Some of the best places for upward mobility for low-income children include fast-growing, coastal metros like San Francisco, New York and Boston. The areas where socioeconomic outcomes are often worst are typically in the South and eastern portion of the Midwest – areas where housing and the economy overall are growing more slowly.
Part of the problem is that while incomes have generally grown faster in places where home values have increased more quickly than in others, they’re not growing fast enough. For the past few decades, home value appreciation has far outpaced income growth in virtually all areas. The result is that in addition to a growing home value gap between areas ripe for social mobility and areas with a worse outlook, there is also an emerging affordability gap (figure 3).
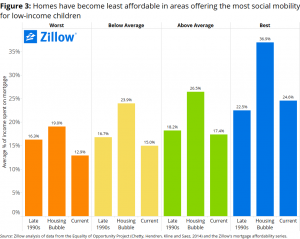
In the late 1990s, the typical mortgage payment consumed 16.3 percent of a home buyer’s income in the worst places for social mobility and 22.5 percent in the best, a gap of 6.2 percentage points. Today, this gap has almost doubled. And while mortgage affordability has actually improved somewhat in the worst areas for social mobility, it has gotten worse in the best. The average mortgage payment in places offering the least mobility now consumes 12.9 percent of income, compared to 24.6 percent in the best places – a gap of 11.7 percentage points.
Social Mobility and Rents
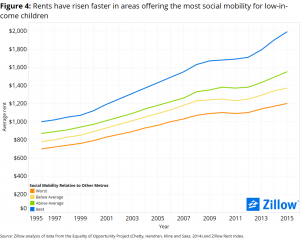 A similar story exists for renters, with rents steadily rising for years. And unlike home buyers, renters don’t benefit from low interest rates. But while most Americans are increasingly feeling the burden of rising rents, rents have grown even more quickly among the historically best metros for mobility.
Between the late 1990s and today, average rents increased 95.1 percent in the areas with the best social mobility and 66.7 percent in the areas with the worst social mobility (figure 4).
And again, similar to mortgages, rental affordability (measured as the share of income needed to afford typical rents in an area) has suffered particularly in the areas offering the most social mobility for low-income families.
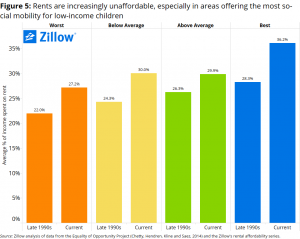
In the late 1990s, the average renter could expect to spend 28.3 percent of his income in the best places for social mobility and 22 percent in the worst places – a gap of 6.3 percentage points. Recently, however, that gap has grown to 9 percentage points. Renting in metros with the best mobility costs an average of 36.2 percent of the median income, compared to 27.2 percent in places with the worst mobility (figure 5).
A Silver Lining?
But there is some hope for the 88.9 million Americans at the bottom of the income distribution that want a better life for their kids. There are many factors to weigh when settling down and raising a family, but for those considering only housing affordability and social mobility, the Great Plains could be a great option. Metros in this region have historically displayed high rates of social mobility, while also offering some of the nation’s more affordable housing options. For example, the average child in Ames, Iowa, who grew up in a low-income family would have ascended into the upper-middle class by age 30. Median home values in the area have cumulatively grown 46.5 percent from the late 1990s through today, but have remained low ($161,900 as of February) compared to the national median ($184,600 in February).
Some markets in the Northeast and northern Mid-Atlantic states also typically fare pretty well. Though home values and rents have generally increased modestly, much like the Great Plains, metros in these regions offered some of the best social mobility. In Scranton, Pennsylvania, for example, home values have grown 56.1 percent since the late 1990s, and the area’s typical home is valued at $107,200, well below the national median. The average child who grew up in a low-income family in and around Scranton in the 1980s and 1990s would be solidly in the middle class by the age of 30.
Looking Ahead
Given these trends, it will be increasingly difficult for the next generation to achieve the same degree of social mobility as in the past. Recent growth in home values over the past few decades could essentially be shutting the door to the middle class by preventing low-income families from being able to affordably live in places that allow them to ascend the socioeconomic ladder.
But while this analysis focused on a cohort of individuals born in the 1980’s, subsequent research from Chetty and Hendren suggests that measures of mobility have remained stable over the past 50 years. This keeps open the possibility that avenues for public policy intervention do exist to help ensure children from all socio-economic classes have the opportunity to achieve the American Dream.
[1] Economic standing is based on household income relative to the national income distribution. To measure economic standing as a child, Chetty and Hendren averaged parental incomes between 1996 and 2000 to estimate the lifetime earnings of the parents. Economic ranking as an adult was similarly measured, using each individual’s average household income between 2010 and 2012. All incomes were inflation-adjusted and converted to 2012 dollars.
[2] This corresponds to the 25th percentile of the national income distribution. For reference, the inflation-adjusted federal poverty threshold for a family of four during this time was $23,050.
[3] This effect is not driven by differences is incomes or income growth across the two metros. While a small handful of salaries in San Luis Obispo are much larger than the highest salaries in Chicago, the interquartile range and median household incomes are quite similar. A typical salary in San Luis Obispo is actually slightly lower than a typical salary in Chicago. Instead, this effect implies that San Luis Obispo offers something—perhaps better educational access or community and social service programs—that enables the average low-income child to better increase his social standing.
[4] We define the late 1990s as the average between 1996 and 1998. “Today” refers to the end of 2015, unless specified otherwise.
This article was originally posted to Zillow and can be found HERE.