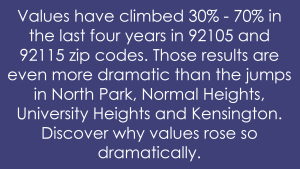
City Heights (92105) and College area (92115) are densely populated and ethnically diverse neighborhoods. They span the corridor of University Avenue and El Cajon Boulevard, from midway between 1-805 & 1-15 eastward to about 65th Street. Cynics see these zip codes as challenged, with higher crime and needing more intense management. But here’s another truth: this area is studied nationally as an example of urban renaissance.
A billion dollars of infrastructure improvements and 1000 apartments converted to condos (another $300 million of private investment) had a focused, strategic impact. A thousand new homeowner households put down roots and stabilized the area. Those people also spent hundreds of millions on furniture and other improvements. New businesses are moving in.
Renaissance
These two zip codes are the most diverse in the county in cuisine, language, race and religion. Like international cities, they are vibrant and interesting places. The population is younger and has a higher percentage of singles than the county’s other 98 zip codes.
In March 2015, San Diego Magazine named City Heights as one of the best places to live in San Diego. (That surprised me too!) The area’s benefits include: variety of local amenities, convenience to buses and freeways, upgraded schools, and a stable housing market.
In the last generation, Sol Price, founder of Price Club, was a visionary who led the area’s transformation. Starting in 1993, with the building of a new police station, many projects in the area that are part of San Diego’s Smart Growth strategy were funded in part by private organizations. Sol Price and Joan Crock, widow of McDonald’s founder, were major investors. Community-centric projects, concentrating primarily on education, crime reduction, economic improvements, smart urban growth, renewal of community pride and improvement of overall quality of life, have served to enhance – and maintain – City Heights “melting-pot” identity.
Recent projects include San Diego’s first alternative fuel station, retail complexes, mixeduse developments, several expanded and improved schools, an “urban village” with a city’s most active branch library, a gymnasium, and a number of innovative uses of open spaces as parks, including the new Central Avenue Skate plaza. The new Copley-Price Family YMCA, includes a 7,500-square-foot gym, two pools, a soccer field, and demonstration kitchen in a LEED-certified building. These improvements have brought more people here.
So why have these zip codes done better than North Park?
Here are three ideas:
- People tend to over-react.
When the Great Recession hit and the stock market collapsed, jobs, fortunes, and business were lost. Fear caused many to abandon assets, to lose hope and perspective. In the recession the “cash flow” zip codes like 92105 and 92115 dropped further and faster than chic spots like the beach. Since these areas fell most, they were then able to rebound by a bigger percentage.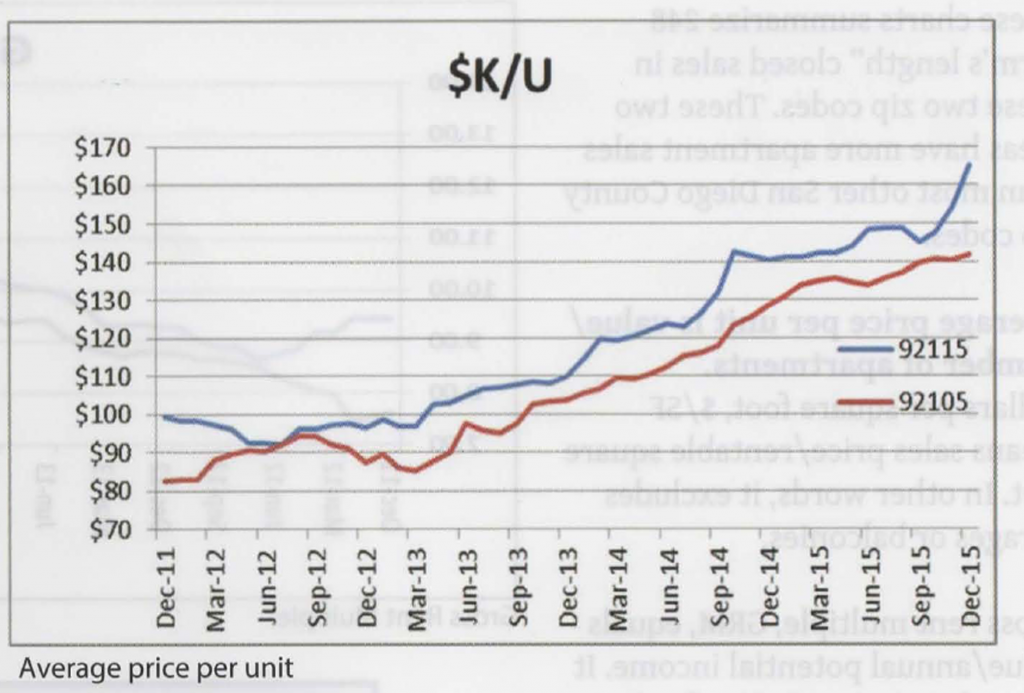
- Good things are happening in these zip codes and those trends are likely to continue. plus the
92105 and 92115 residents have gained a greater percentage of the jobs during this recovery than the rest of the county. They needed those jobs.
- These zip codes have more affordable housing than most of the county. The demand for affordable housing is immense, which means lower vacancy rates. Those factors imply that these zip codes also provide higher leverage in rehabilitation and repositioning plays.
Candidly, I did not discover these truths in my first recession. Now that I have silver hair, I recognize more patterns. We should all be wiser now than we were 20 years ago.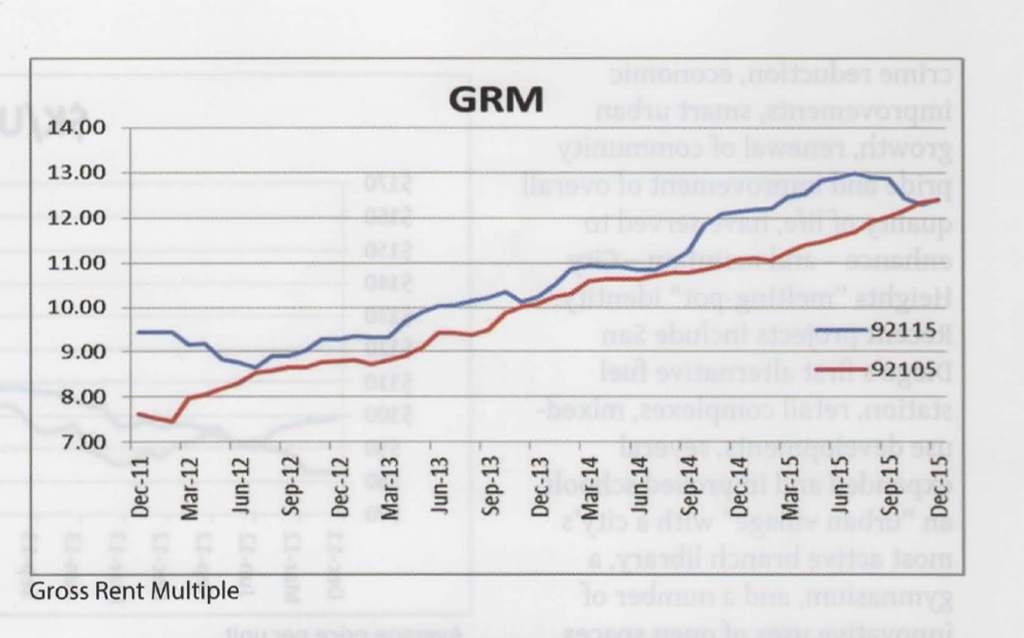
The math behind the charts
Each graph shows a rolling average of the previous year. The first point on each graph shows the results of all the sales in 2011. The next point drops the January 2011 sales and substitutes the January 2012 sales. The last point has the averages for all of 2015. The rolling average shows how bank appraisers report value. The appraisal limits potential loan amount.
These charts summarize 248 “arm’s length” closed sales in these two zip codes. These two areas have more apartment sales than most other San Diego County zip codes. Average price per unit is value/ number of apartments. Dollars per square foot, $/SF means sales price/rentable square feet. In other words, it excludes garages or balconies. Gross rent multiple, GRM, equals value/annual potential income. It shows how many years of today’s rent the market pays for an asset.
Conclusion
Next is So What? Don’t expect another gigantic jump in the next few years. Wise investors periodically ask: “What is the goal?” If I did not own this asset, would I pay that much for it? Is the property I own today the best means to attain my goal? Perhaps moving equity could be better. Curious about your property’s value?
As an SDCAA member you can receive a complimentary, confidential value estimate. Our team will value 100 buildings this year. For a generation we have focused on your success. Contact us to learn what your asset is worth.
About the author: Terry Moore, CCIM served seven years as SDCAA and State Association Director. He is part owner of ACI, the firm which has closed more 92105 & 92115 escrows than the next three companies combined. Contact Terry at 619-889-1031, tmoore1031@gmail.com or SanDiegoApartmentBroker.com
This article was originally featured in RentalOwner Magazine, information about the magazine and its subscription service can be found HERE.